Monitoring server uptime using Uptime Kuma
Posted on June 25, 2023 (Last modified on March 8, 2024) • 6 min read • 1,098 wordsIntroduction to using Uptime Kuma to monitor the uptime of servers and services
Introduction
Monitoring the uptime of servers is crucial for any organisation to ensure their systems are available and performing optimally. In this blog post, we will explore Uptime Kuma, an open-source monitoring tool that allows you to track and visualise server uptime and downtime effectively. We’ll discuss the features of Uptime Kuma, its setup process, and how it can help you gain valuable insights into your infrastructure’s availability.
As usual, this applies to both large and small infrastructures, like my homelab, as it is important to be aware of when servers or services go offline ⚰️.
What is Uptime Kuma
Uptime Kuma is a lightweight, user-friendly, and open-source uptime monitoring solution. If you’ve come across UptimeRobot, then you might be familiar with uptime monitoring and Uptime Kuma is very similar. Uptime Kuma provides a simple and intuitive web interface to monitor the availability of servers, websites, services, docker container, databases plus more! With Uptime Kuma, you can set up checks to monitor the uptime, response time, and status of your servers, ensuring that you are alerted about any downtime or performance issues.
Key Features
Dashboard: Uptime Kuma offers a visually appealing and customisation dashboard that provides an overview of all your monitored servers. It allows you to quickly identify the availability and response time of your infrastructure at a glance.
Flexible Monitoring Options: Uptime Kuma supports various monitoring methods such as ICMP ping, HTTP(S), SSL certificates, TCP, DNS, Webpage keywords, Docker Containers and database monitoring plus many more options. This flexibility enables you to monitor a wide range of services and protocols based on your specific requirements.
Alerting and Notifications: Uptime Kuma allows you to configure alert rules and notification channels to receive timely notifications about server downtime or performance degradation. You can choose to receive alerts via email, SMS, or popular messaging platforms like Slack.
Historical Data and Reporting: The tool collects and stores historical uptime data, allowing you to generate reports and analyse trends over time. This feature helps you identify patterns, troubleshoot issues, and make data-driven decisions to improve your infrastructure’s reliability.
Integration and Extensibility: Uptime Kuma provides integrations with popular monitoring and notification services like Prometheus, Grafana, and PagerDuty. Additionally, it offers an API that allows you to extend its capabilities and integrate it with your existing monitoring ecosystem.
Setting up Uptime Kuma
Installation: Uptime Kuma can be deployed as a Docker container or run natively on Linux, macOS, or Windows systems. The official Uptime Kuma documentation provides detailed instructions for each installation method.
Configuration: After installation, configure Uptime Kuma by specifying the servers or endpoints you want to monitor, along with their corresponding monitoring parameters. This includes defining the monitoring method (e.g., ICMP ping or HTTP), check intervals, and alert thresholds.
Customise the Dashboard: Customise the Uptime Kuma dashboard to suit your preferences. Add widgets, rearrange elements, and choose the key metrics you want to monitor prominently.
Set Up Alerting: Configure alert rules and notification channels in Uptime Kuma to receive alerts when a server or endpoint experiences downtime or exceeds defined thresholds. Specify the notification recipients and the preferred communication channels.
Explore Historical Data and Reporting: Utilise the historical data stored by Uptime Kuma to gain insights into server uptime patterns, identify recurring issues, and track improvements. Leverage the reporting capabilities to generate uptime reports and share them with stakeholders.
Docker Compose
I’ve deployed Uptime Kuma to one of my Raspberry Pi’s (cirrus) which will be my dedicated uptime monitoring server. The Pi is perfect for this as it’s lightweight and has no problem running the Uptime Kuma docker container as it is also very lightweight. Here’s my docker-compose.yaml to get started:
    version: '3.3'

    services:
        uptime-kuma:
            image: louislam/uptime-kuma:1
            container_name: uptime-kuma
            volumes:
                - ./data:/app/data
        ports:
            - 3001:3001
        restart: always
As usual, it’s easy as creating this docker-compose.yaml in a suitable location and running docker compose up -d. Then visit the IP:3001 (or hostname if you set one up) of the machine running the container.
In the spirit of automation I deployed the container using Ansible to the Pi. You can find the pretty basic playbook here on my GitHub. You can also use an Ansible plugin called lucasheld.uptime_kuma to configure Uptime Kuma using Ansible. I’ve left some tasks commented in that playbook using the plugin but decided add monitors myself in this case.
Adding a Monitor
It’s very easy to configure Uptime Kuma and took me around 10 minutes to manually configure my notifcations using Slack and add all my monitors. The screenshots below show the pages for adding a new monitor:
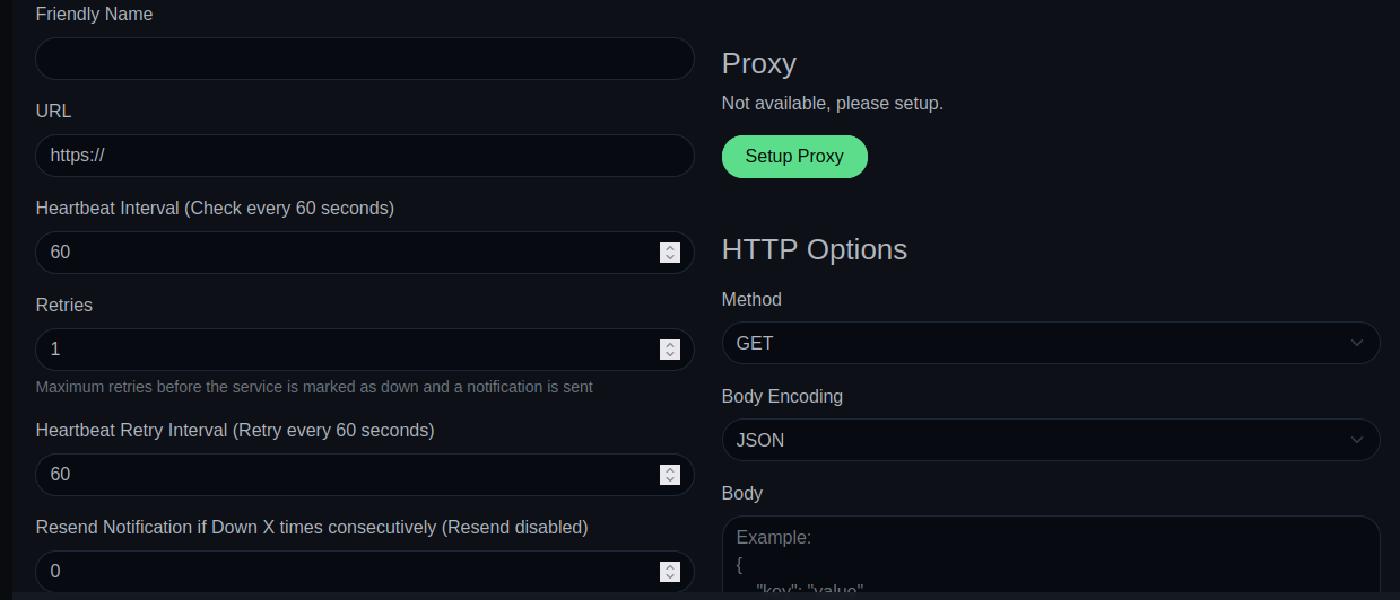
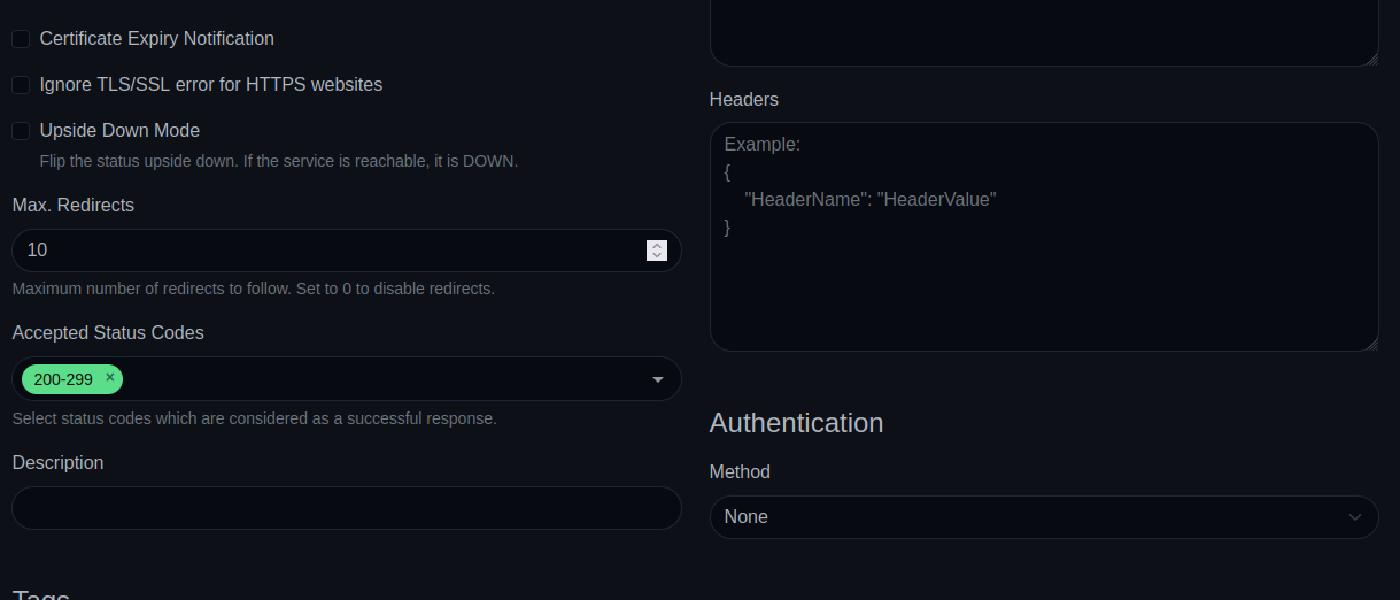
Once you’ve filled in all the required fileds you can click “Save” and your monitor is created. You’ll be presented with a dashboard of all monitors and some “Quick Stats”. As you can see it’s very easy and straightforward to add monitors and the flexible monitoring options are great for fine tuning your monitors.
That’s it! Your monitor is now configured, and if you’ve set up alerting, you will recieve an alert notification when your server/service goes down.
Status Page
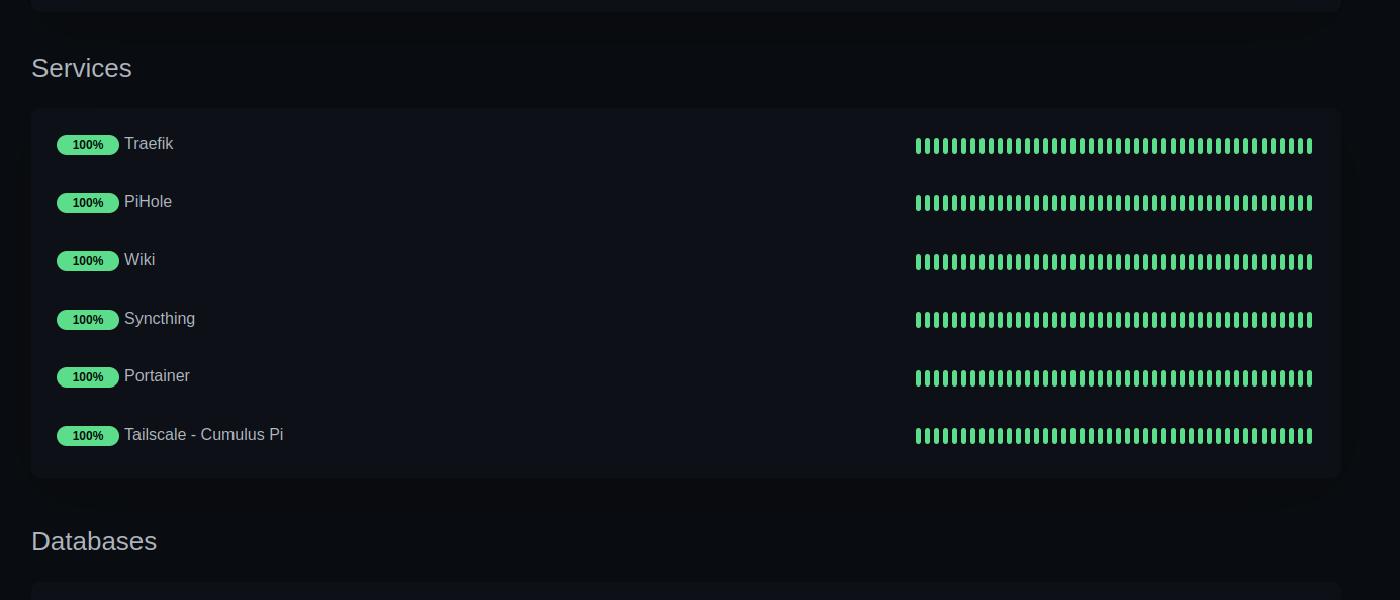
Status Pages allow you to create an overview dashboard for your monitors. I’ve created groups for my monitors and then added the relevant monitors to those groups, shown in the screenshot below.
Status Pages are ideal to visit to get an overview of your infrastructure uptime. The status of a monitor is shown by the uptime in percentage and a timeseries by the progress style bar to the right. This bar will show green, orange, or red to indicate times when a server/service was up, degraded or down. You can also provide your status page URL to users as you would to customers to provide them with access to your service status. You’ll likely be familiar with these types of pages as most websites have them, particularly ones providing a cloud or SaaS service.
Conclusion
Uptime Kuma is a powerful and user-friendly tool for monitoring server uptime and availability. By implementing Uptime Kuma in your infrastructure, you can proactively monitor the health of your servers, identify potential issues before they impact your users, receive instant alerts about downtime incidents, and gain valuable insights into performance metrics. Whether you’re a small business owner, a developer, or an IT professional, Uptime Kuma equips you with the tools you need to maintain reliable services by being aware of service health. In a world where downtime can result in lost revenue, diminished user experience, and damage to your brand reputation, Uptime Kuma offers a robust solution to ensure your website’s availability and performance.
Plus its FREE:double_exclamation_mark: